Visualizing Cluster Metrics with Grafana
The recommended way to visualize metrics is to use Grafana to configure the observability monitoring dashboard for Dubbo.
Before You Begin
- An accessible Kubernetes cluster
- Properly installed and configured Prometheus service
- Installed Grafana
- Deployed Sample Application and enabled metrics collection
Confirm Component Status
Kubernetes
Ensure Prometheus is running
$ kubectl -n dubbo-system get svc prometheus
NAME         TYPE        CLUSTER-IP       EXTERNAL-IP   PORT(S)    AGE
prometheus   ClusterIP   10.0.250.230   <none>        9090/TCP   180s
Ensure Grafana is running
$ kubectl -n dubbo-system get svc grafana
NAME      TYPE        CLUSTER-IP       EXTERNAL-IP   PORT(S)    AGE
grafana   ClusterIP   10.0.244.130   <none>        3000/TCP   180s
Deploy Sample
kubectl apply -f https://raw.githubusercontent.com/apache/dubbo-samples/master/4-governance/dubbo-samples-metrics-spring-boot/Deployment.yml
Wait for the sample application to run, and confirm the application status with the following command:
kubectl -n dubbo-demo get deployments
View Grafana Visualization Panel
After the sample program starts, it will automatically simulate service calls; just wait a bit to see metrics visualized in Grafana.
If Grafana was installed via the Dubbo Admin Panel, access the Admin console and find the Grafana monitoring entry in the left menu.
If Grafana is a standalone installation, access the Grafana console directly:
$ kubectl port-forward service/grafana 3000:3000
Open Grafana console in your browser: http://localhost:3000
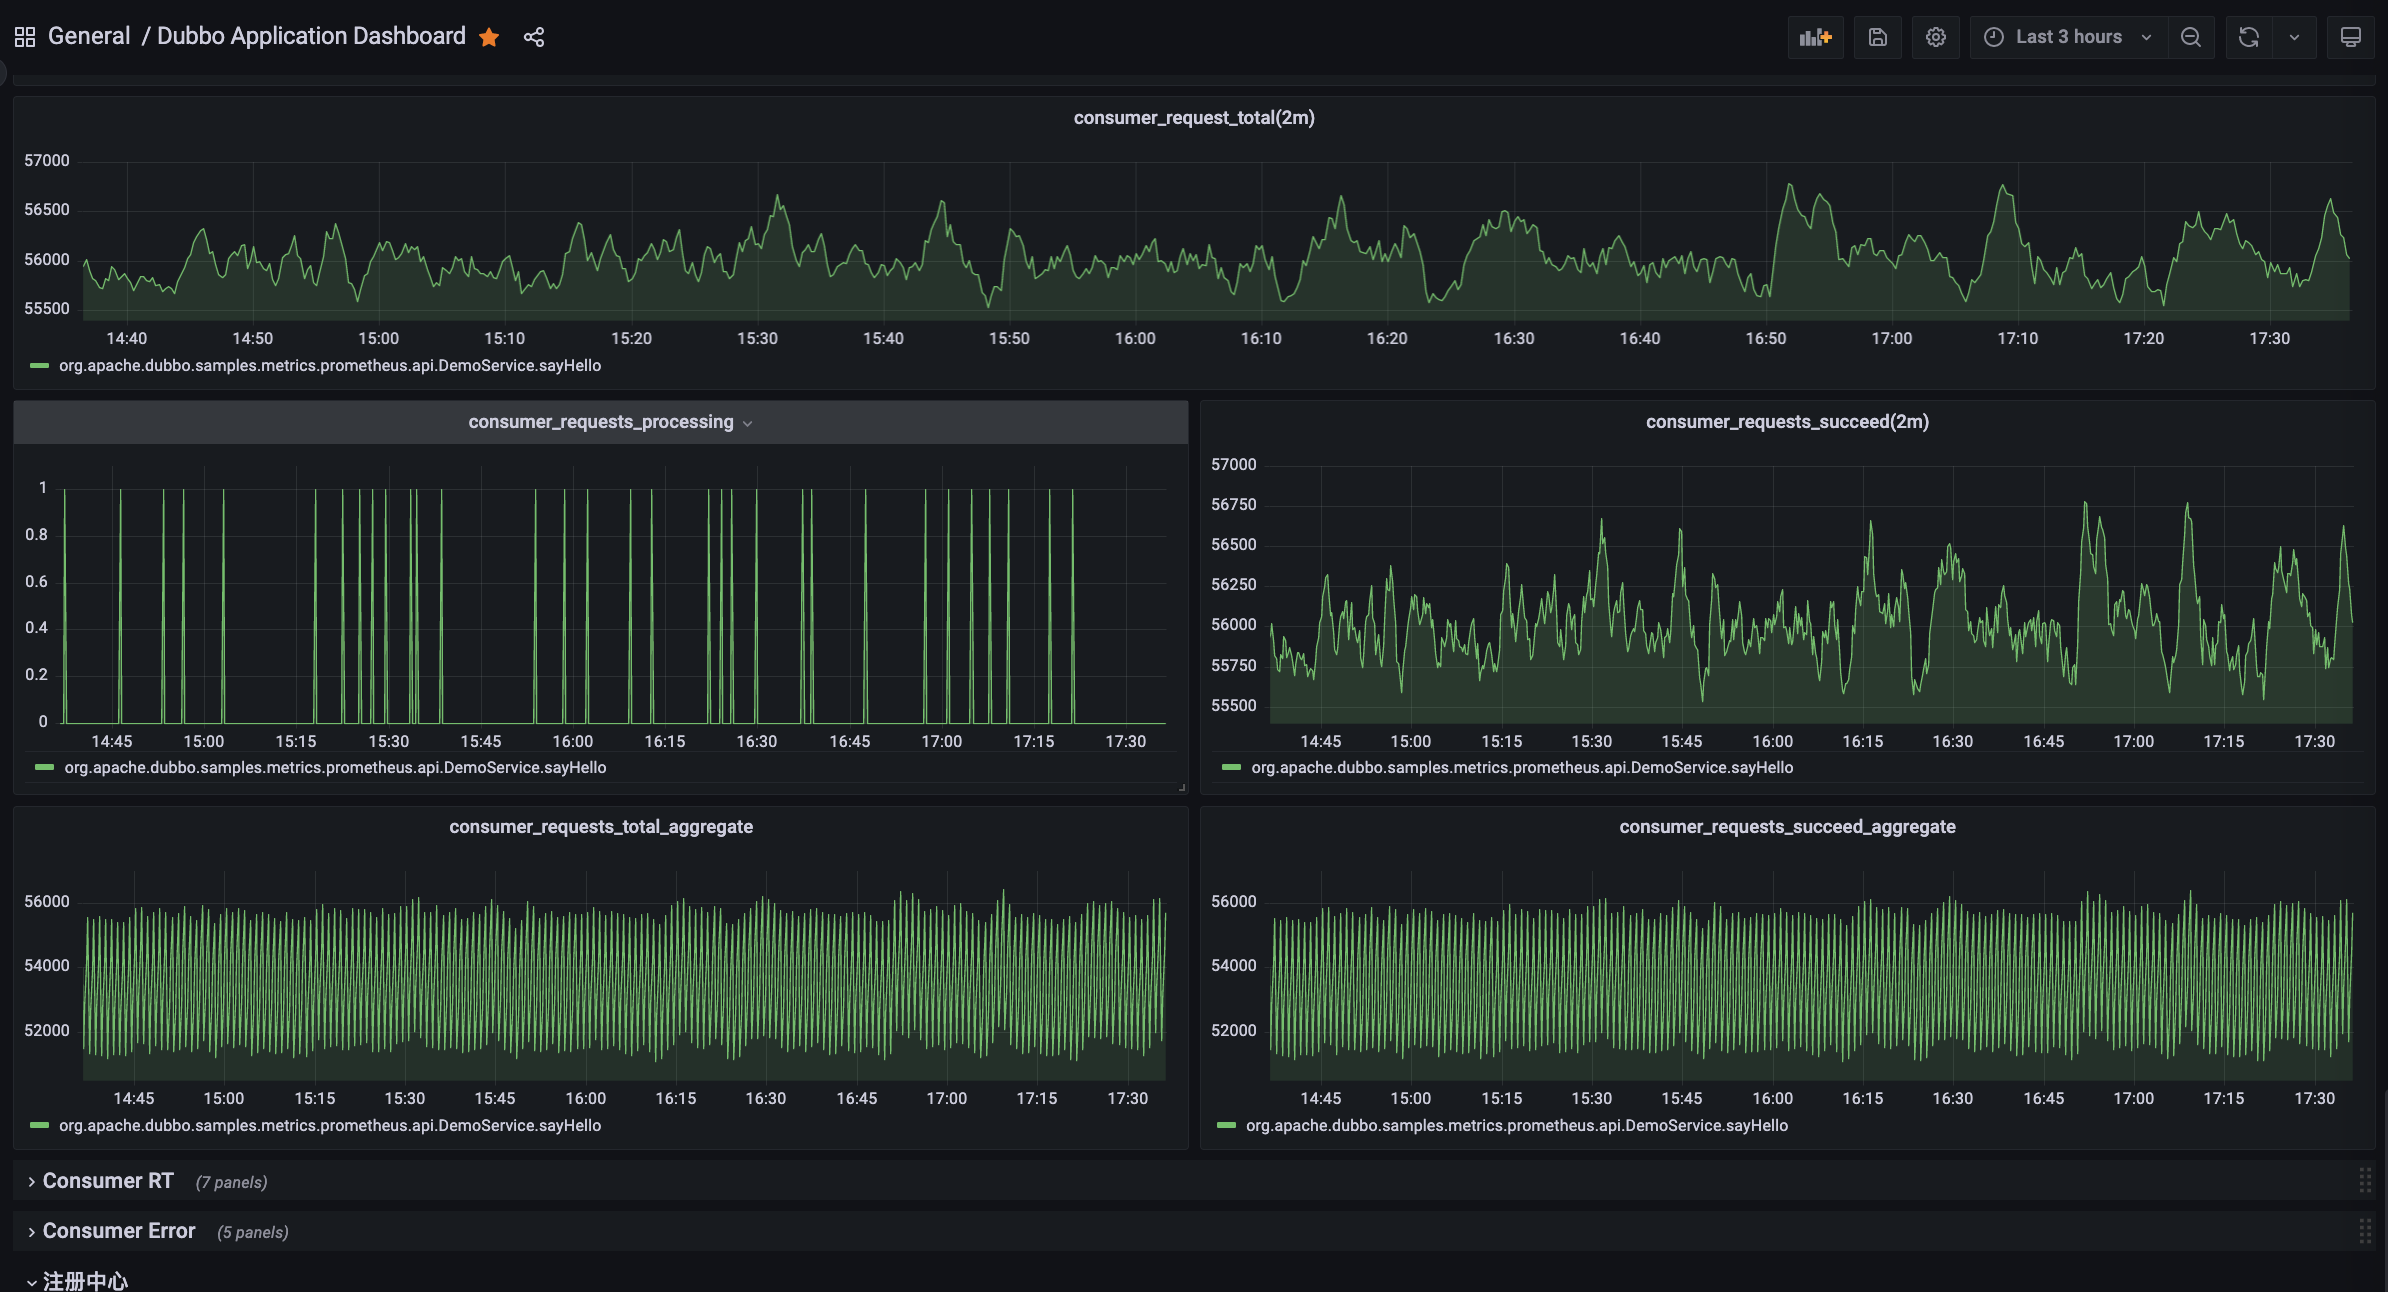
Service Statistics View
Supports application and instance-level statistical views. For each statistical granularity, you can further view:
- Provider traffic view
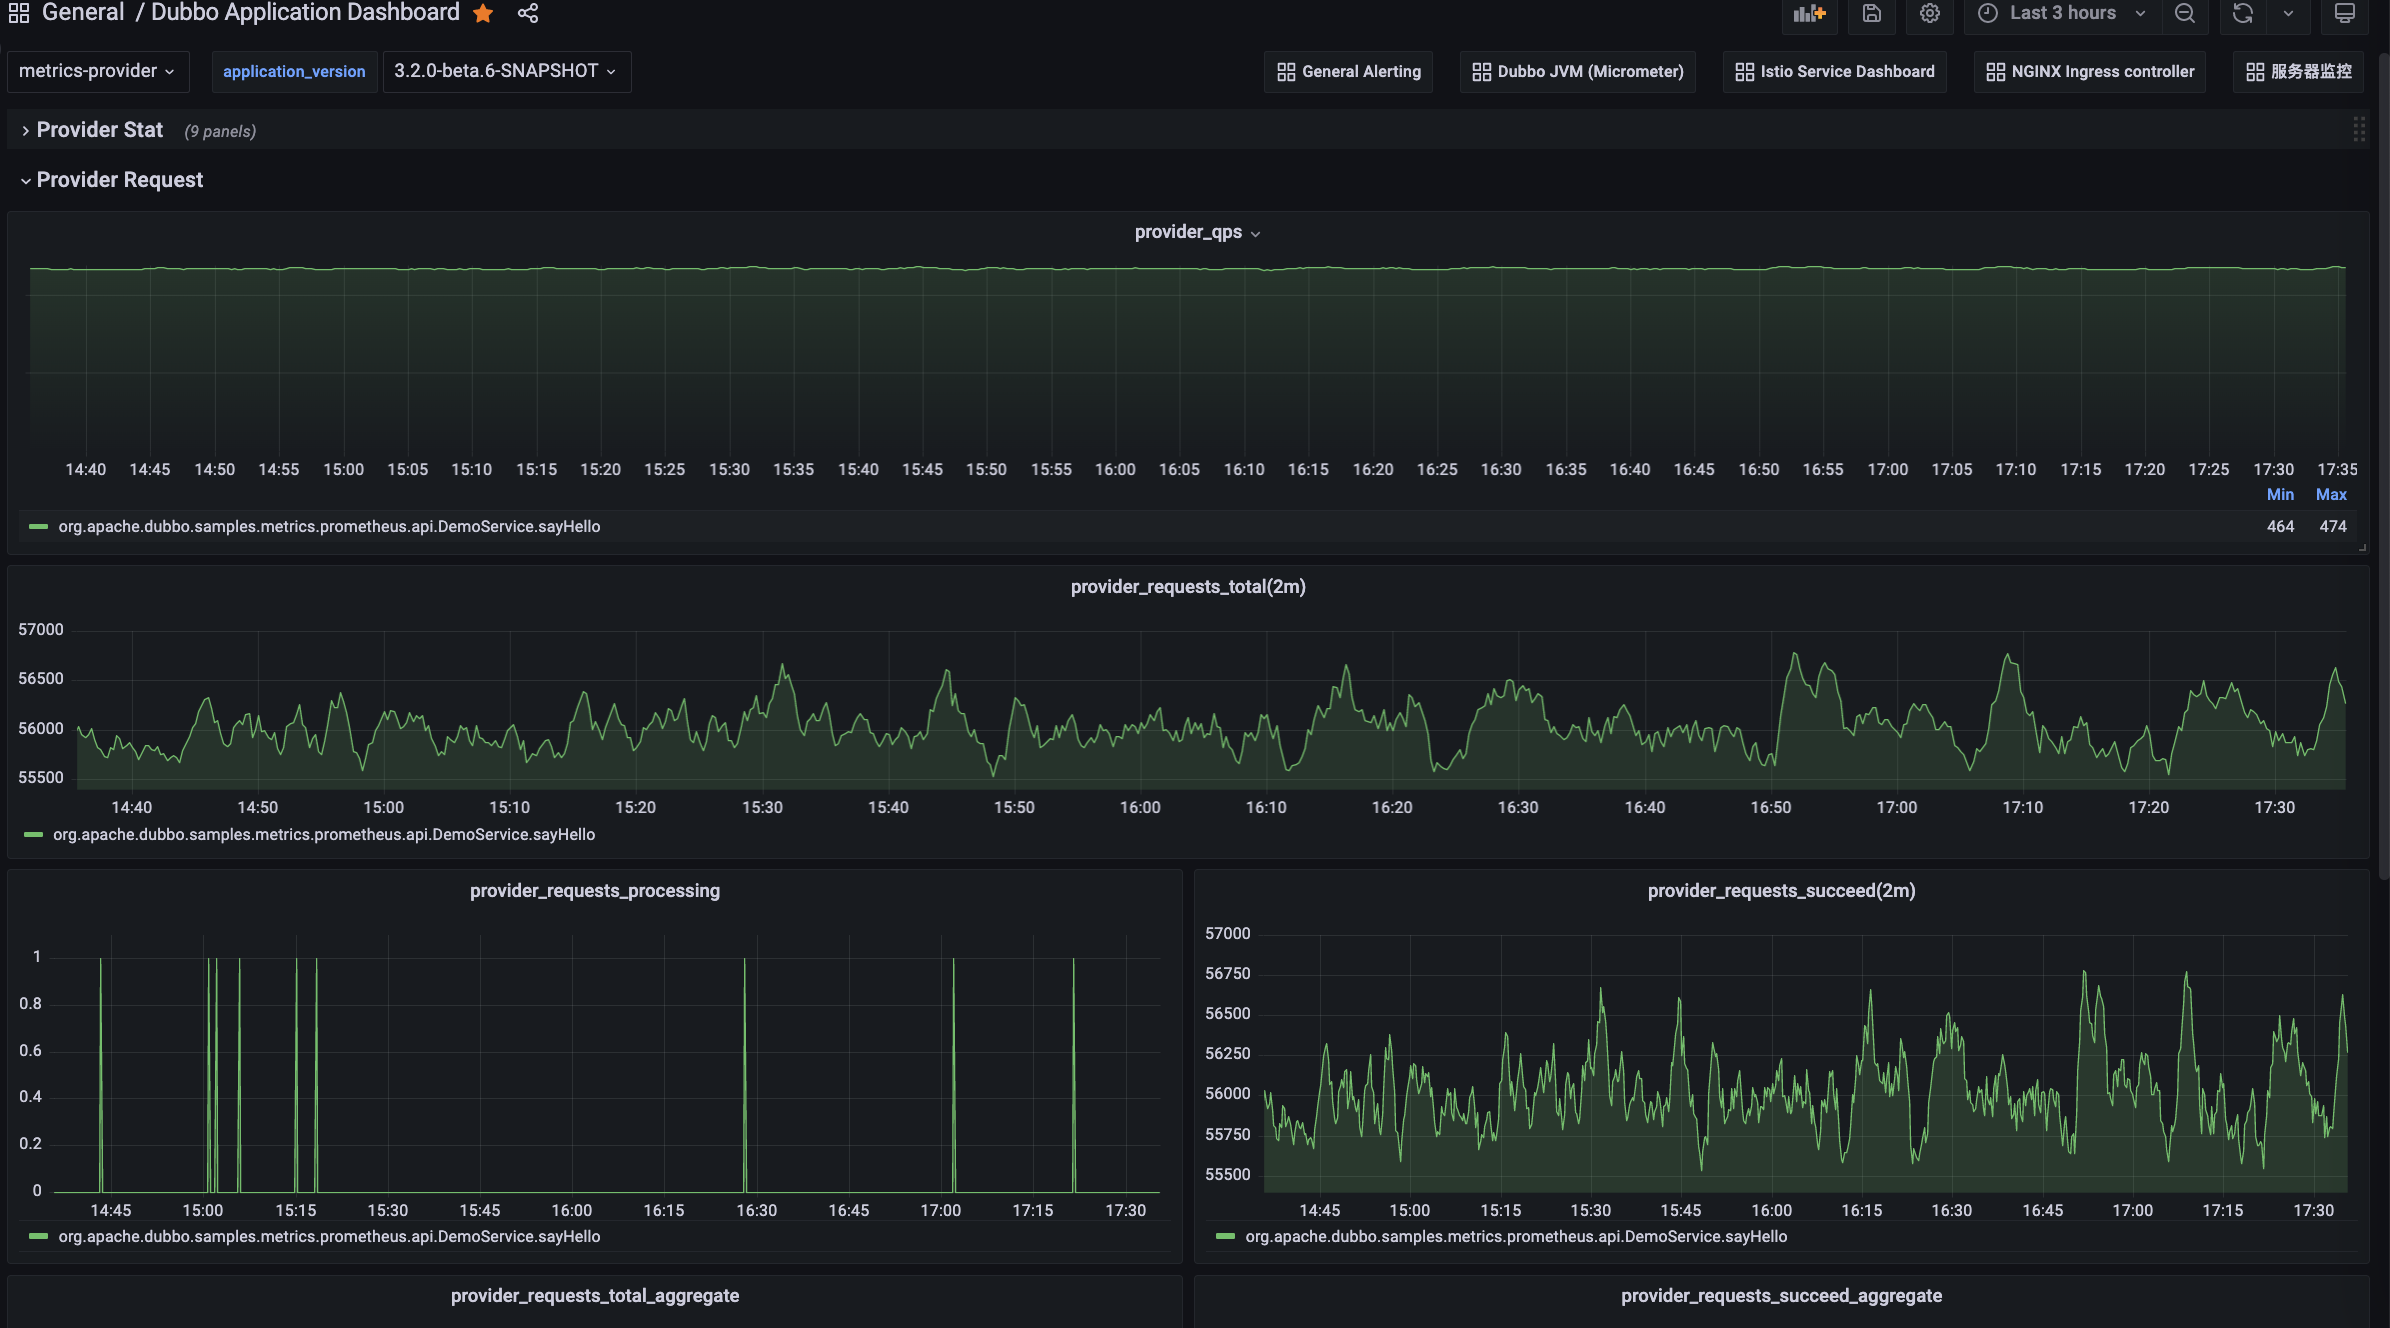
- Consumer traffic view
- Registry center view
TBD
- Configuration center view
TBD
JVM Instance View
About the Official Grafana Dashboard for Dubbo
Dubbo provides rich metric panels. The views mentioned above can be found in Grafana’s official panel library; you can directly import the following templates and configure the data source.
Apache Dubbo Observability Dashboard: https://grafana.com/grafana/dashboards/18469
JVM (Micrometer) Dashboard: https://grafana.com/grafana/dashboards/4701