metrics监控
Dubbo 支持采集运行态 Metrics 指标并接入 Prometheus、Grafana 系统,实现对微服务集群的可视化监控,以下是一个具体的使用示例,可查看 示例完整源码。
Contents
- server/main.go - is the main definition of the service, handler and rpc server
- client/main.go - is the rpc client
- proto - contains the protobuf definition of the API
How to run
Run server
go run ./go-server/cmd/main.go
test server work as expected:
curl \
    --header "Content-Type: application/json" \
    --data '{"name": "Dubbo"}' \
    http://localhost:20000/greet.GreetService/Greet
Run client
go run ./go-client/cmd/main.go
deploy to local
install prometheus and open prometheus config file prometheus.yml, write the config like this
global:
  evaluation_interval: 15s
  scrape_interval: 15s
scrape_configs:
- job_name: dubbo-provider
  scrape_interval: 15s
  scrape_timeout: 5s
  metrics_path: /prometheus
  static_configs:
    - targets: ['localhost:9099']
- job_name: dubbo-consumer
  scrape_interval: 15s
  scrape_timeout: 5s
  metrics_path: /prometheus
  static_configs:
    - targets: ['localhost:9097']
install grafana and open grafana web page like localhost:3000
open: 【Home / Connections / Data sources】
click 【Add new data source】
select Prometheus
enter 【Prometheus server URL】 like http://localhost:9090 and click 【Save & test】
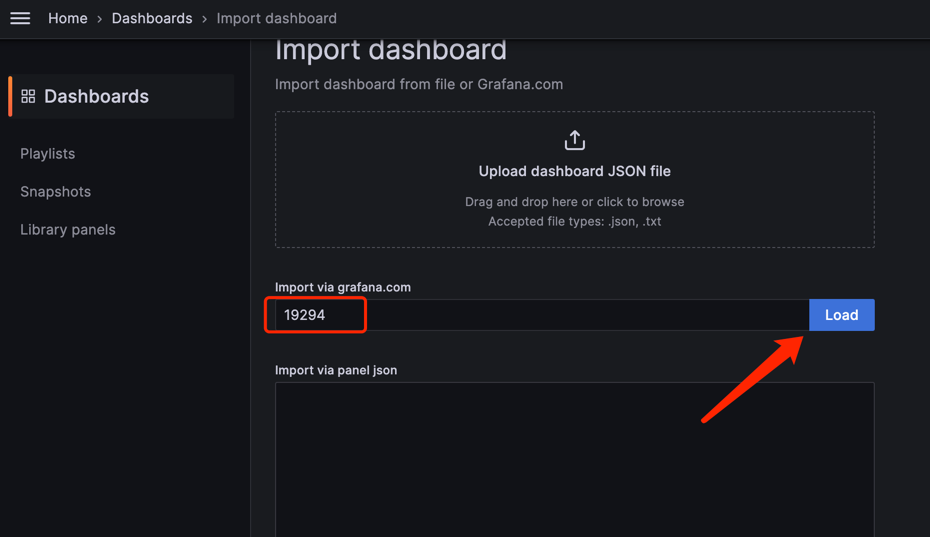
open 【Home / Dashboards 】click 【New】【import】and enter 19294 click Load
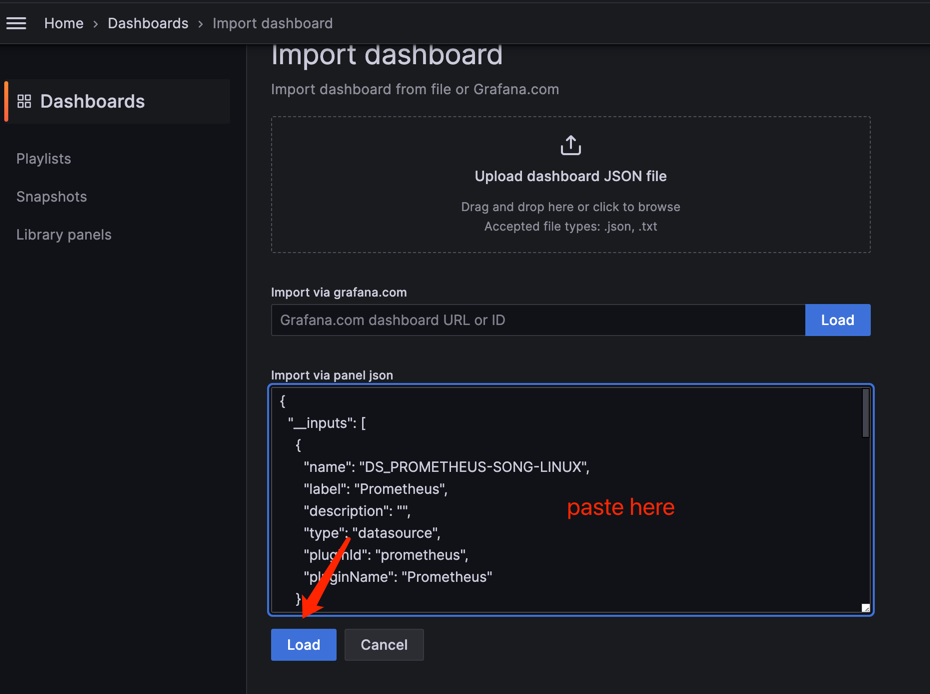
if your grafana can’t access internet you can open https://grafana.com/grafana/dashboards/19294-dubbo-observability/ and click 【Download JSON】
paste the JSON
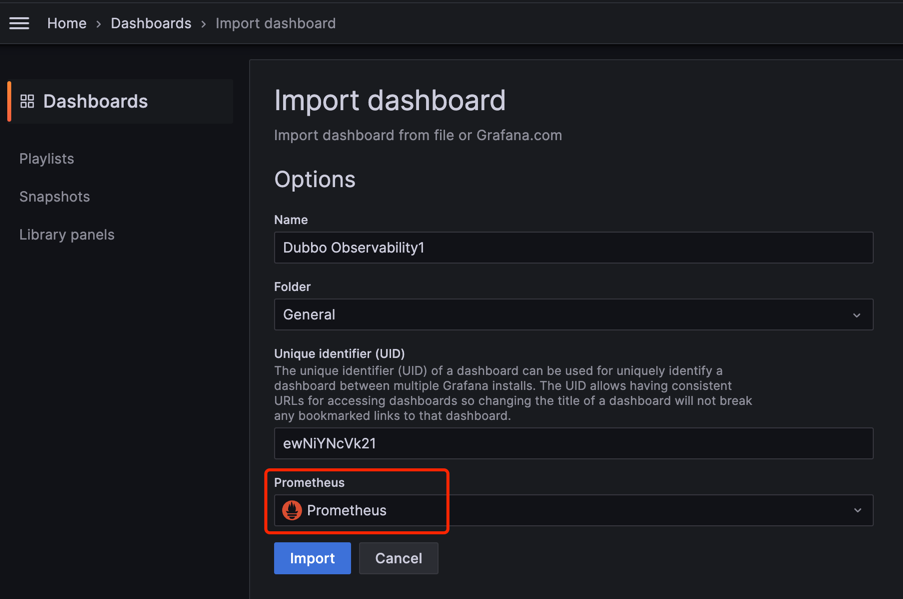
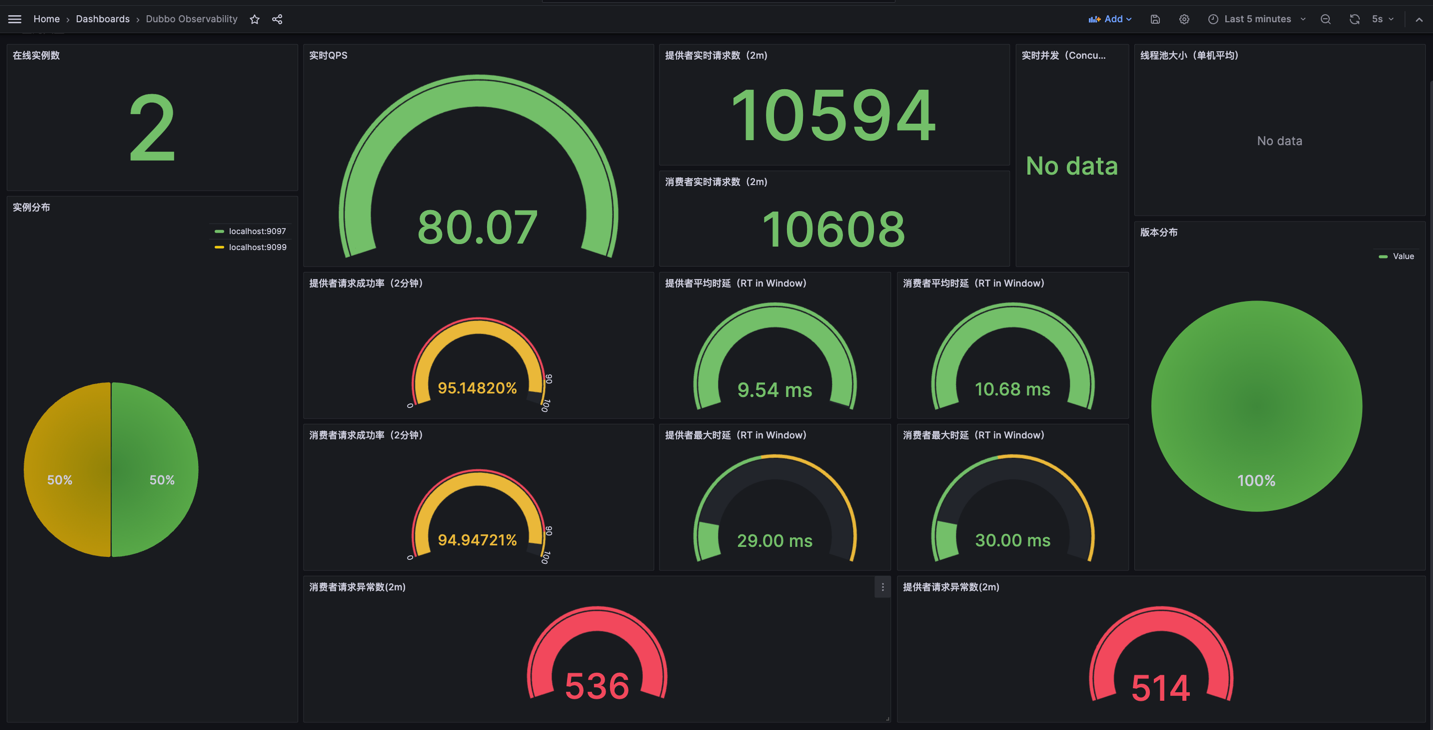
click 【Import】button and you will see the Dubbo Observability dashboard,enjoy it
Deploy to Kubernetes
kube-prometheus
install prometheus in k8s kube-prometheus
Set prometheus-service.yaml type to NodePort
- add
dubboPodMoitor.yamltokube-prometheusmanifestsdir, The content is as follows
apiVersion: monitoring.coreos.com/v1
kind: PodMonitor
metadata:
 name: podmonitor
 labels:
   app: podmonitor
 namespace: monitoring
spec:
 namespaceSelector:
   matchNames:
     - dubbo-system
 selector:
   matchLabels:
     app-type: dubbo
 podMetricsEndpoints:
   - port: metrics # ref to dubbo-app port name metrics
     path: /prometheus
---
# rbac
apiVersion: rbac.authorization.k8s.io/v1
kind: Role
metadata:
 namespace: dubbo-system
 name: pod-reader
rules:
 - apiGroups: [""]
   resources: ["pods"]
   verbs: ["get", "list", "watch"]

---
# rbac
apiVersion: rbac.authorization.k8s.io/v1
kind: RoleBinding
metadata:
 name: pod-reader-binding
 namespace: dubbo-system
roleRef:
 apiGroup: rbac.authorization.k8s.io
 kind: Role
 name: pod-reader
subjects:
 - kind: ServiceAccount
   name: prometheus-k8s
   namespace: monitoring
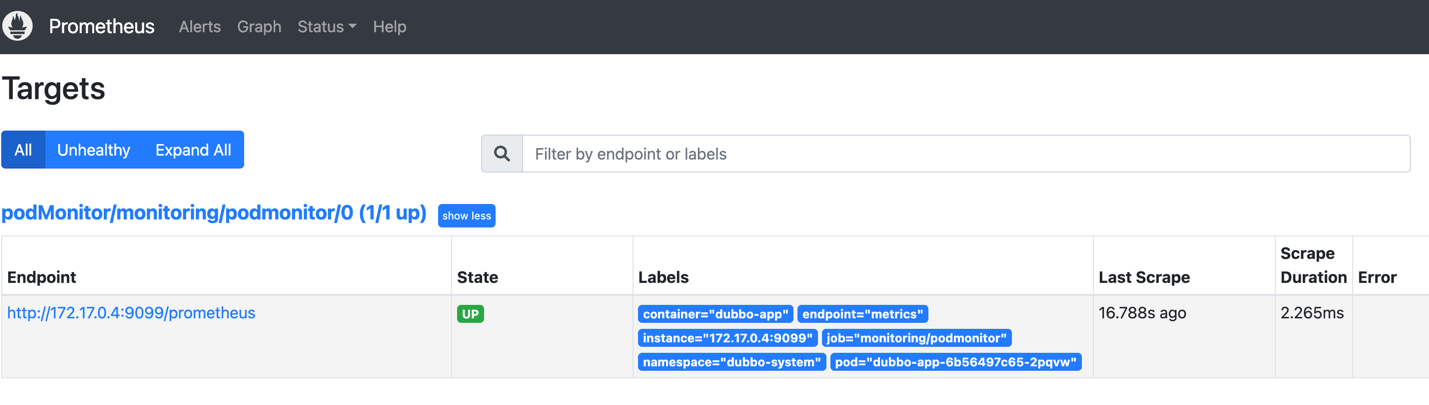
kubectl apply -f Deployment.yaml- open prometheus web page such as http://localhost:9090/targets